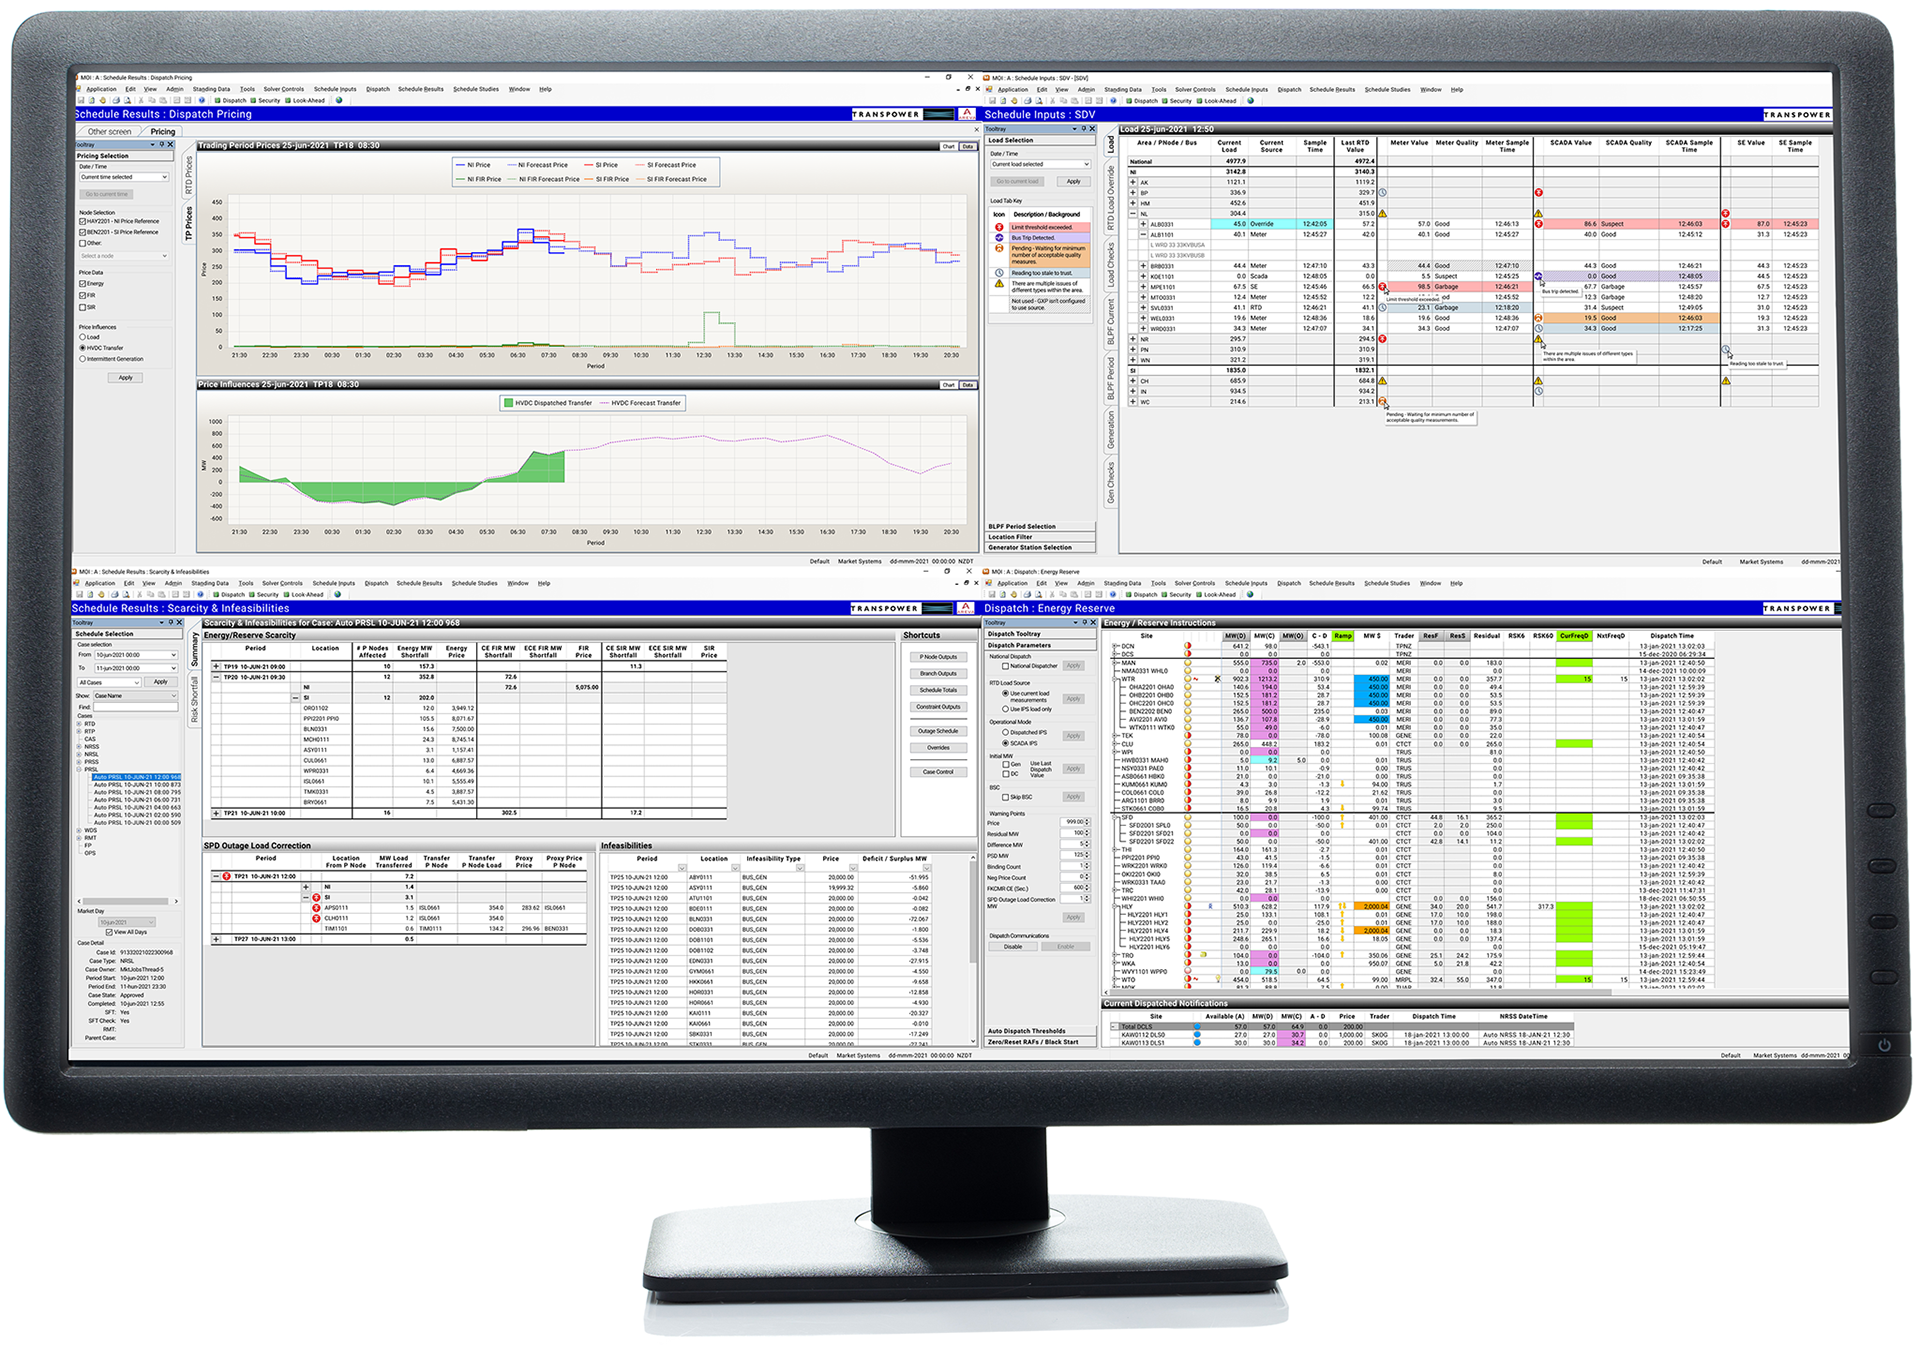
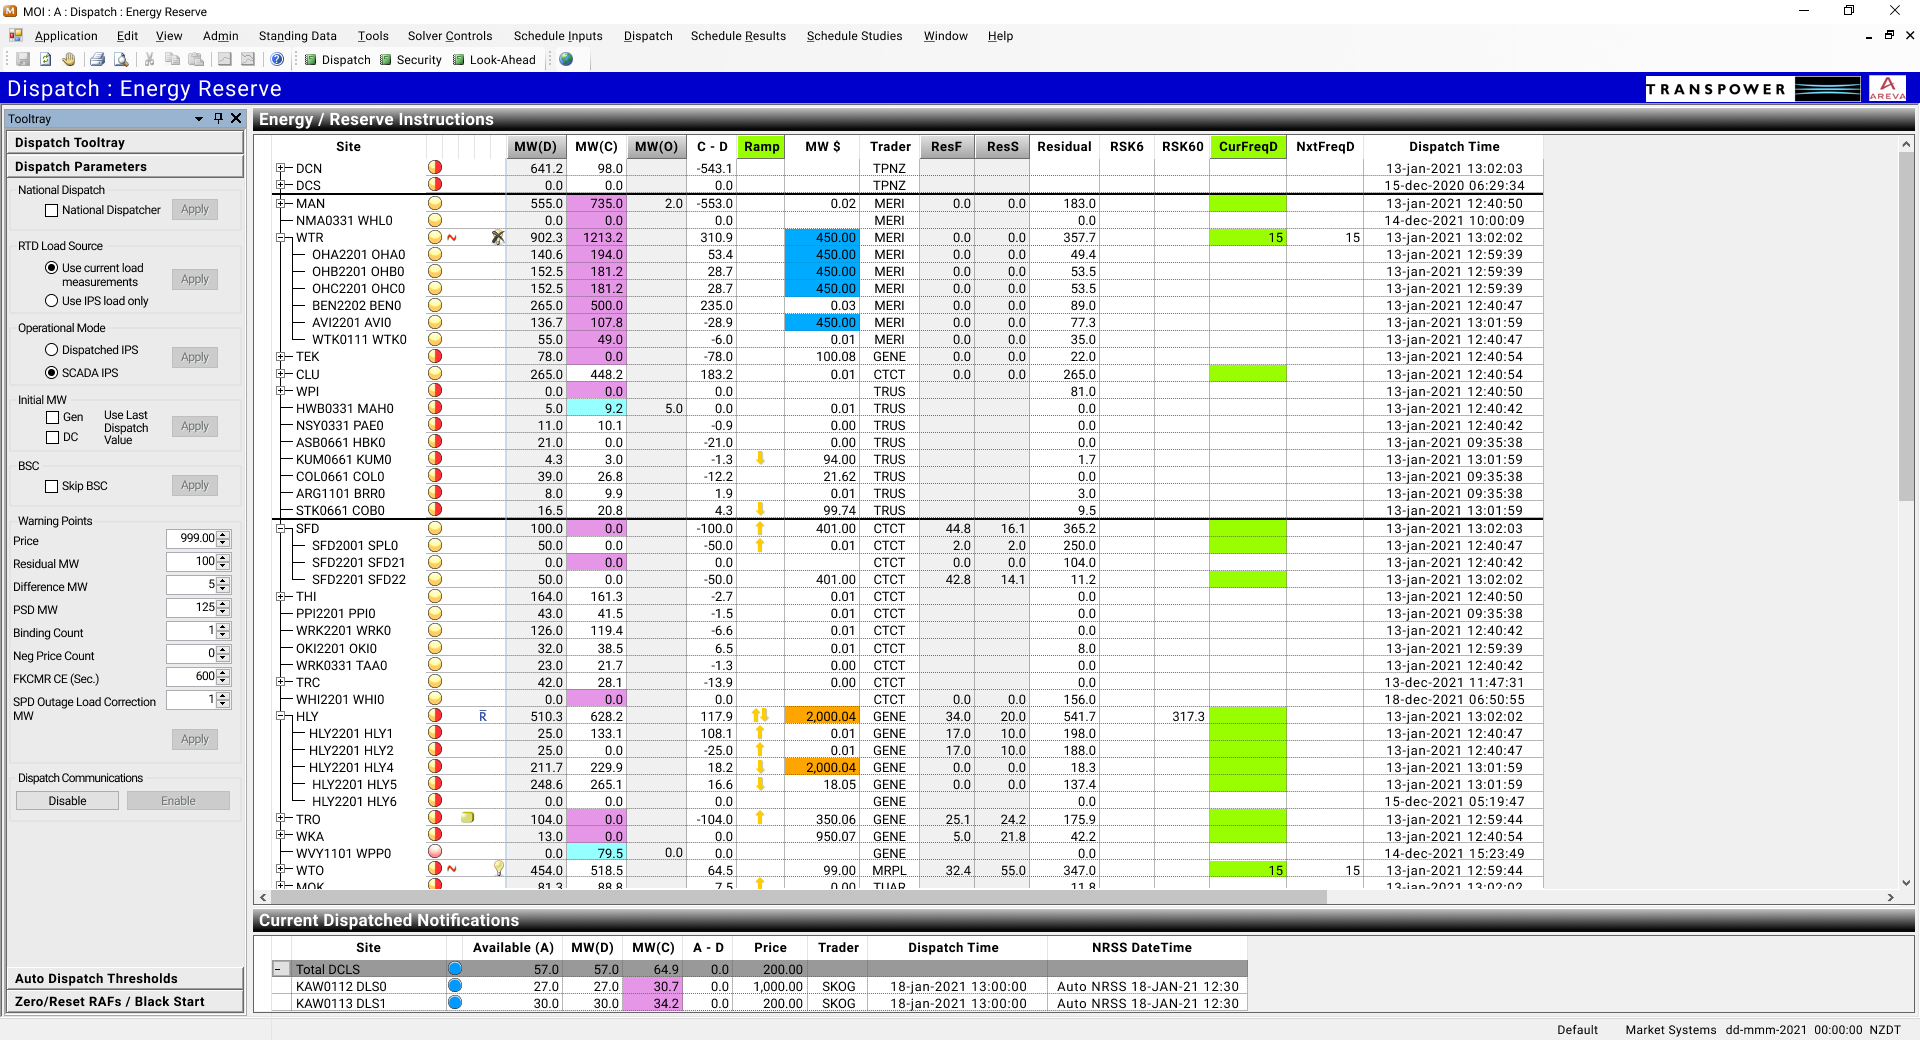
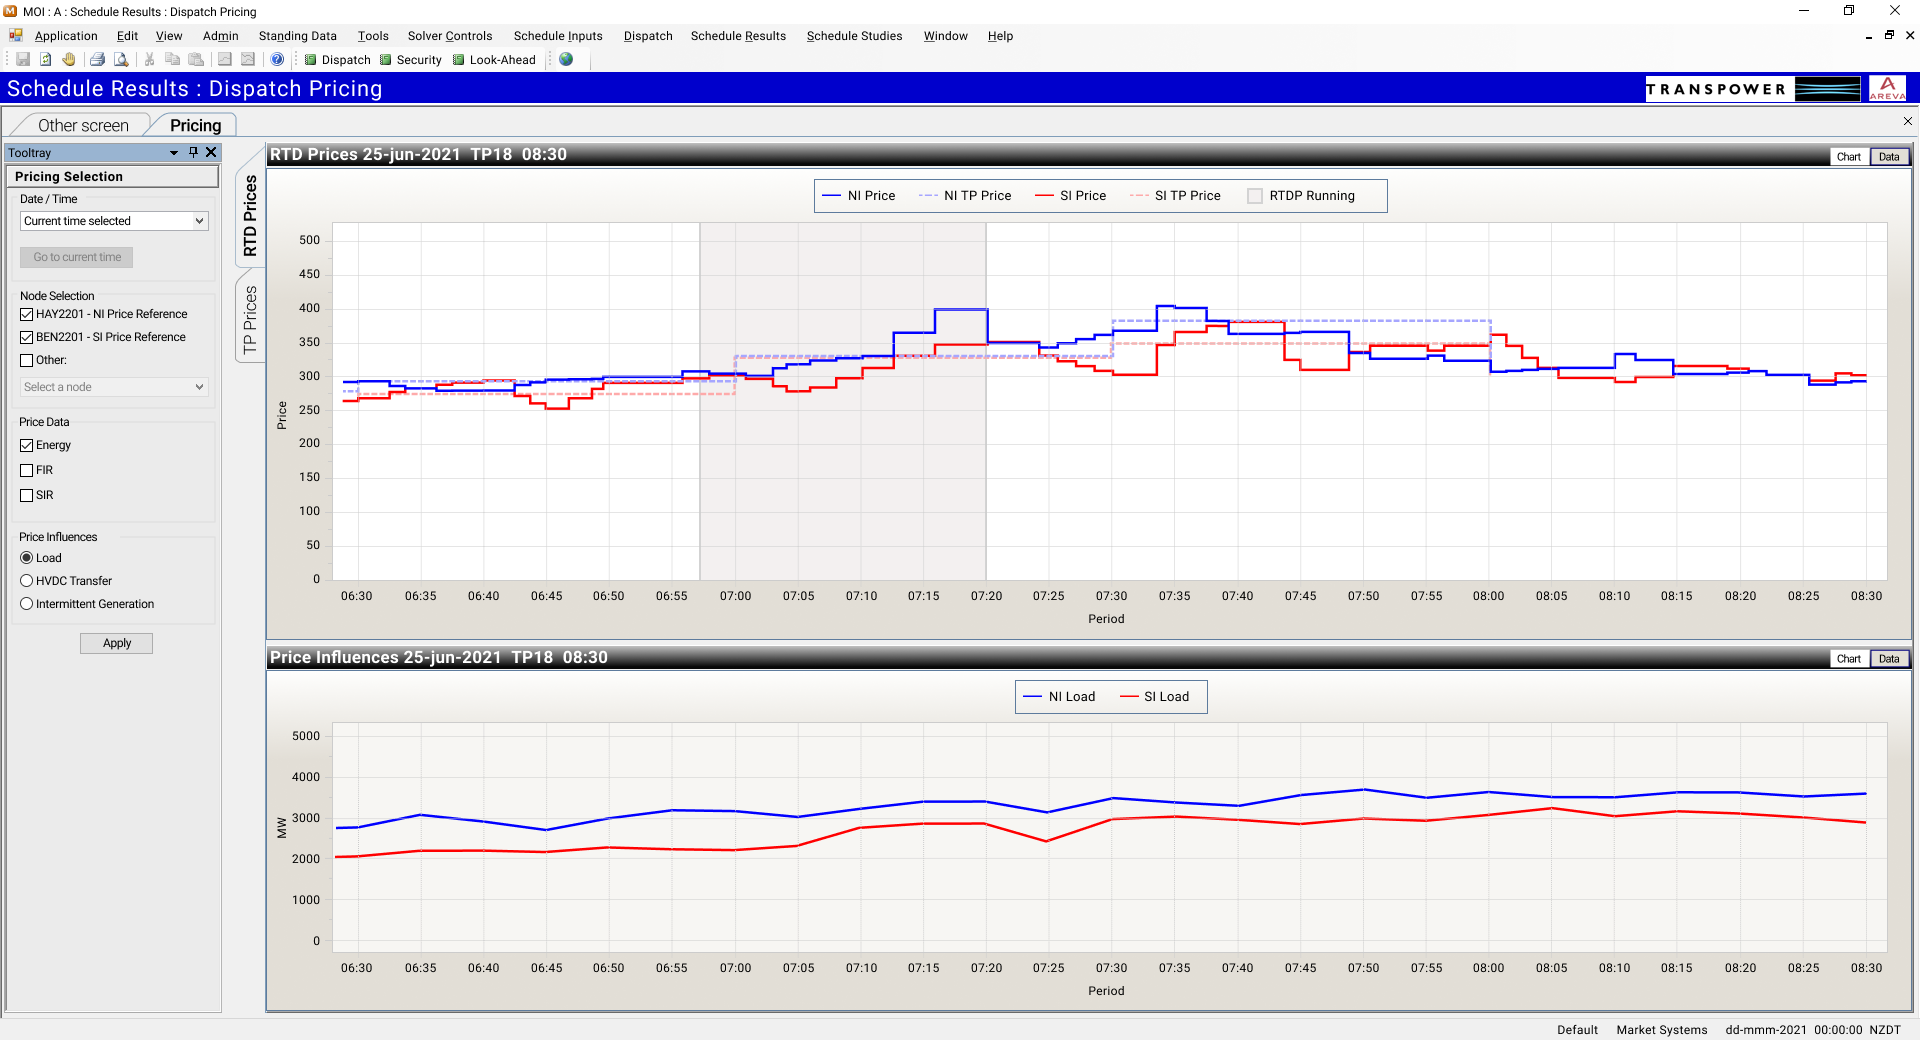
RTP is part of one of many systems that the control center operators use to monitor New Zealand's power grid. The Market Operator Interface system, or MOI as it's commonly called, and it is built using Syncfusion. It displays a series of screens which contain vital information and calculations about electricity demand and pricing across New Zealand.
Because it is only one of many systems an operator must use, only very incremental and thoroughly tested changes can be made. My role was to work with the engineers and operators to make sure the changes and new screens were efficient and easy to use with little to no learning curve required.
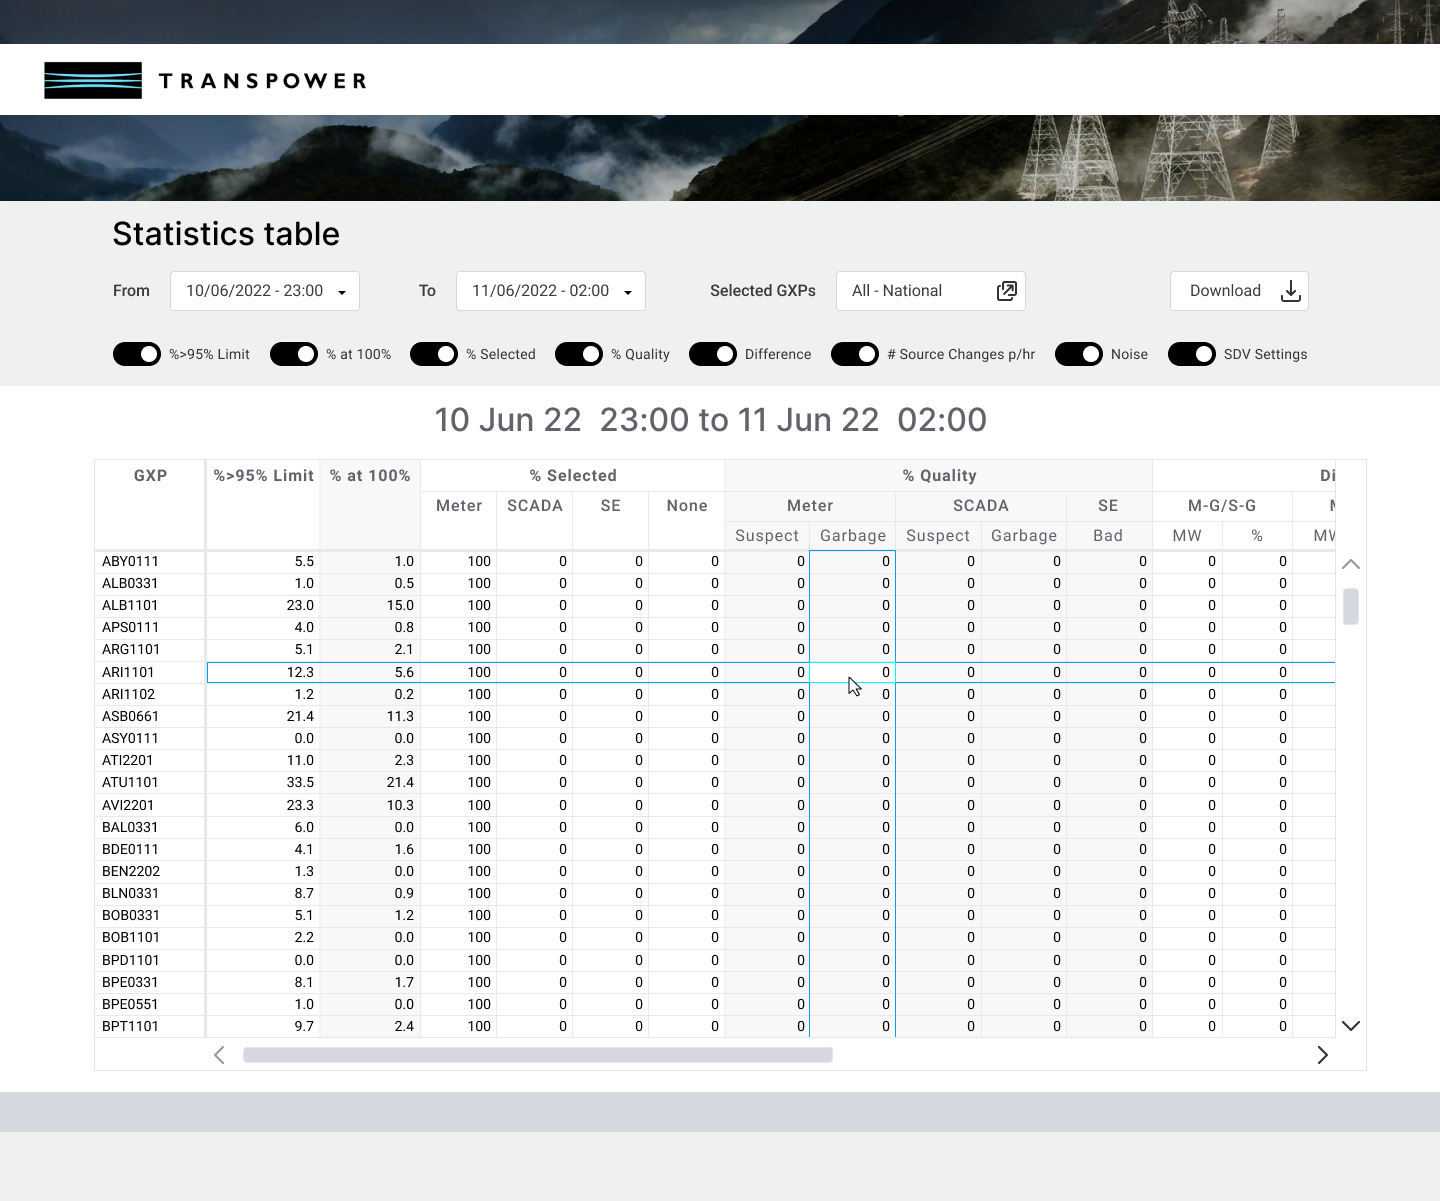
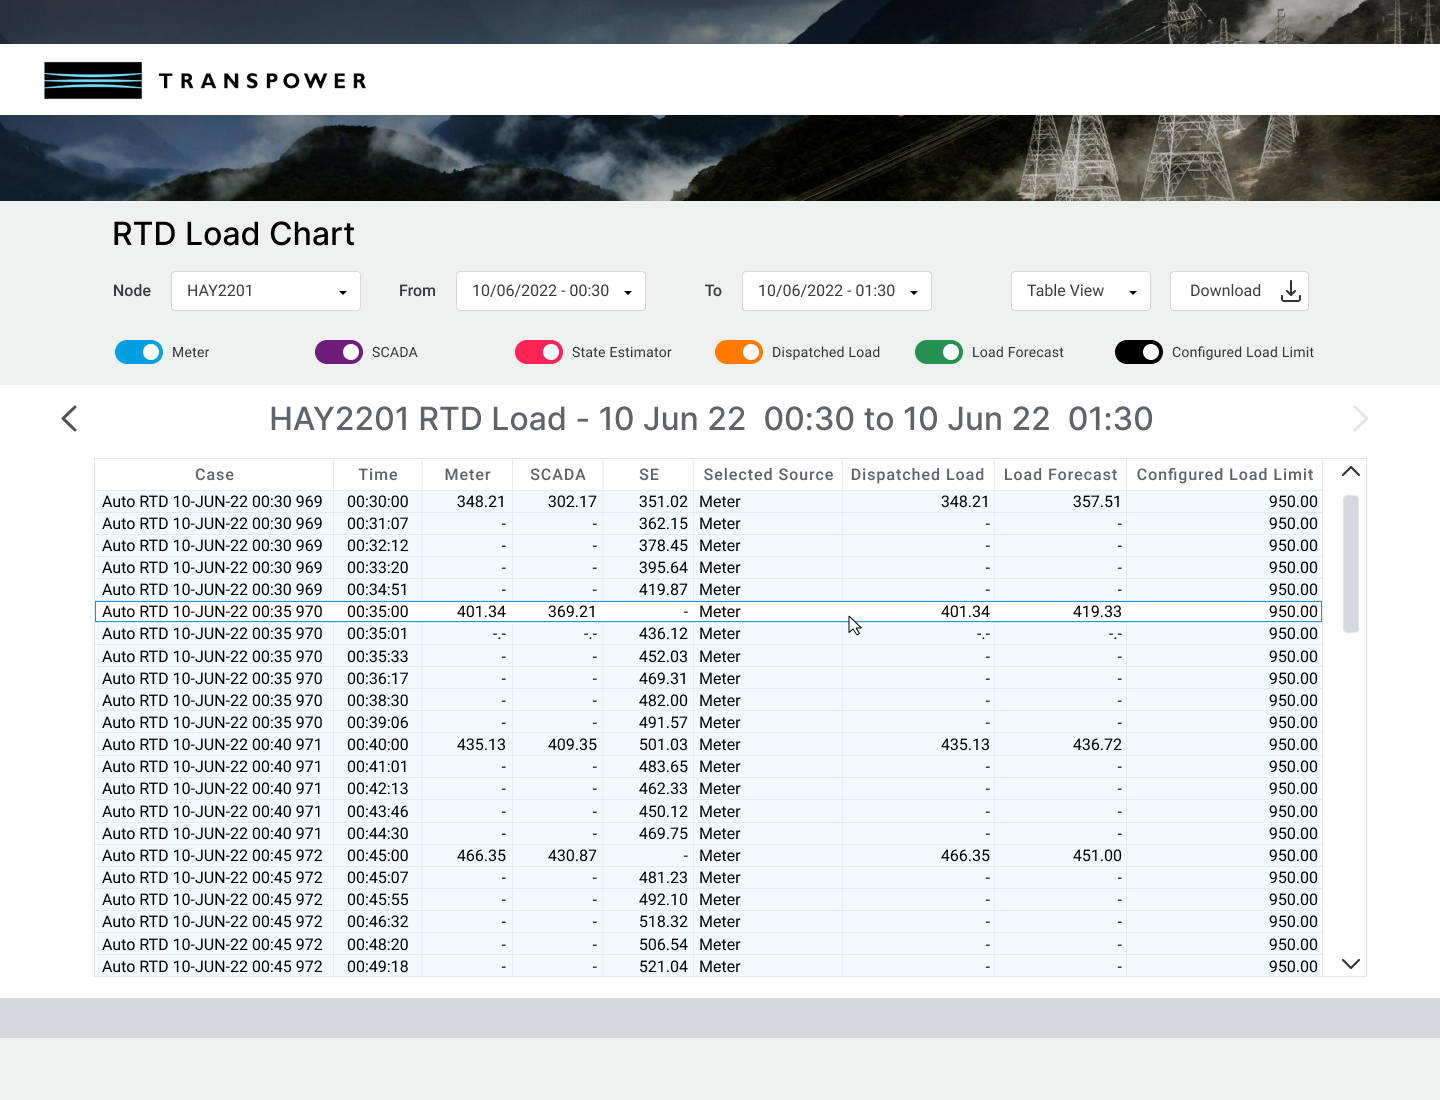
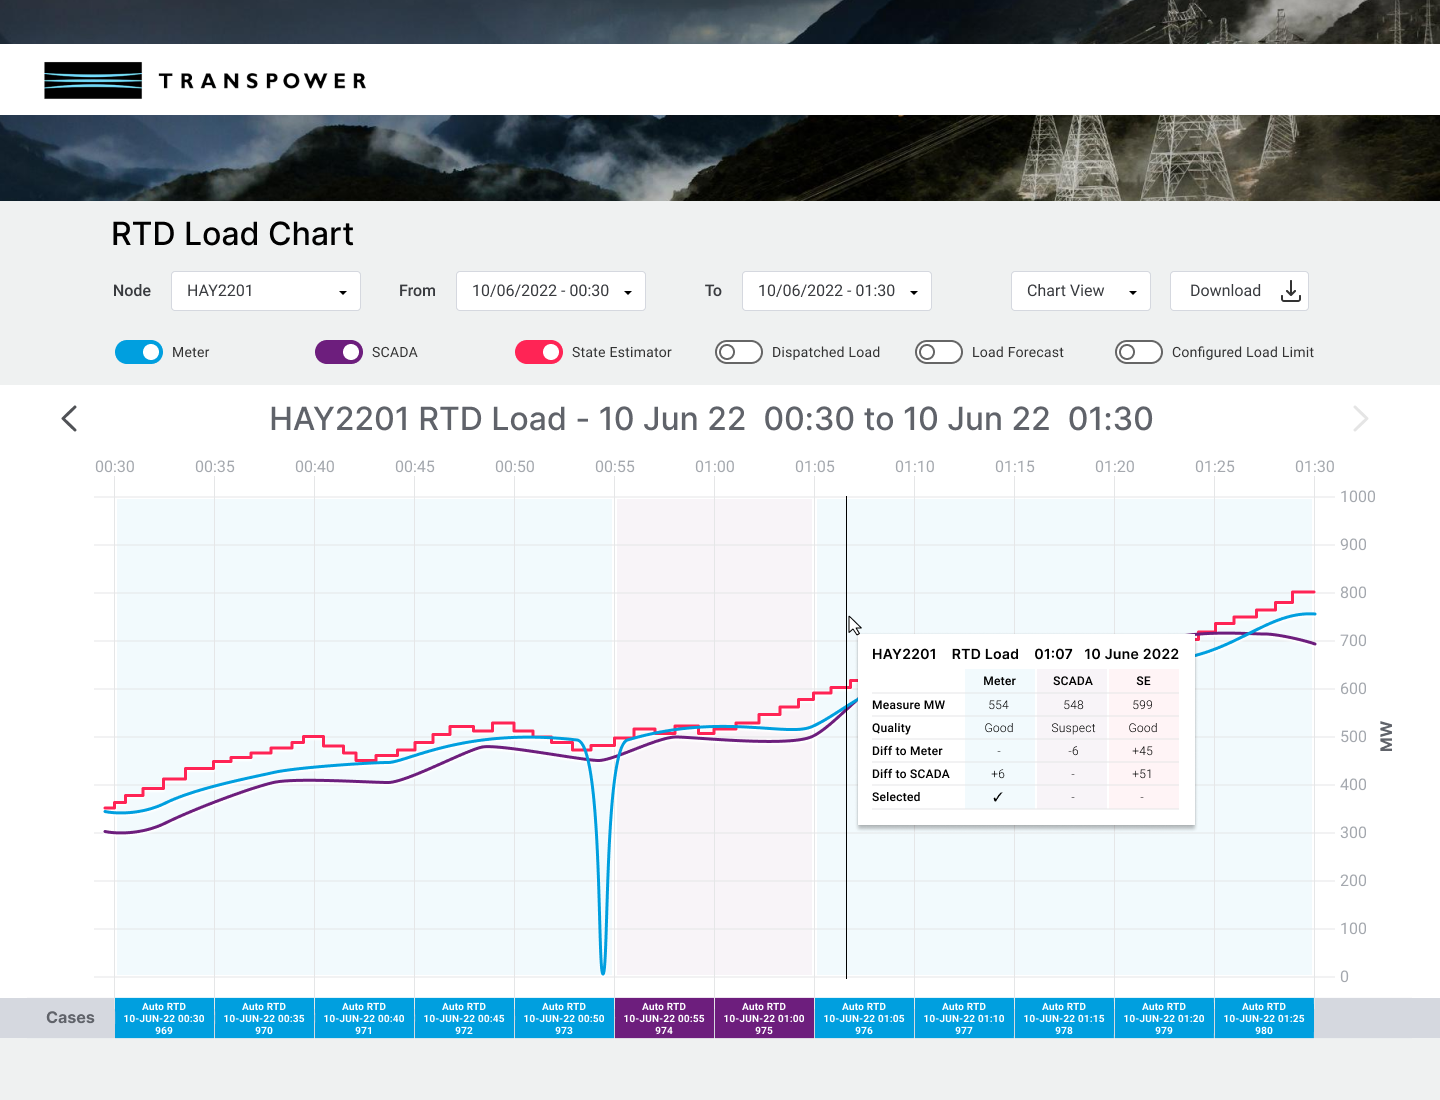
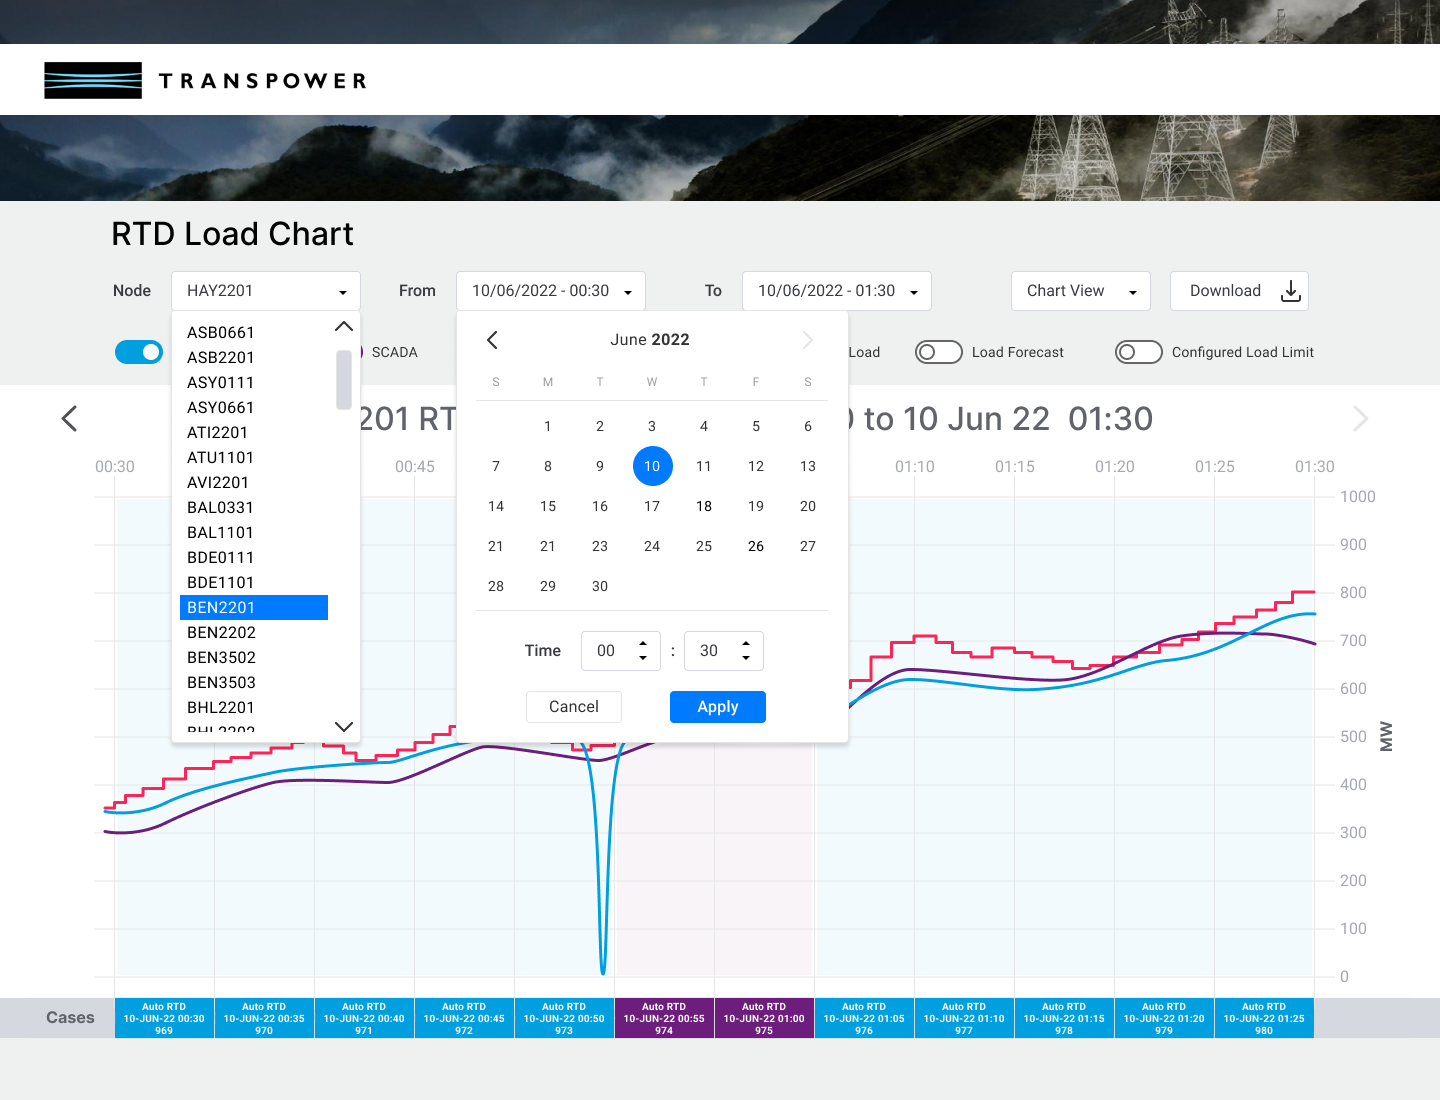
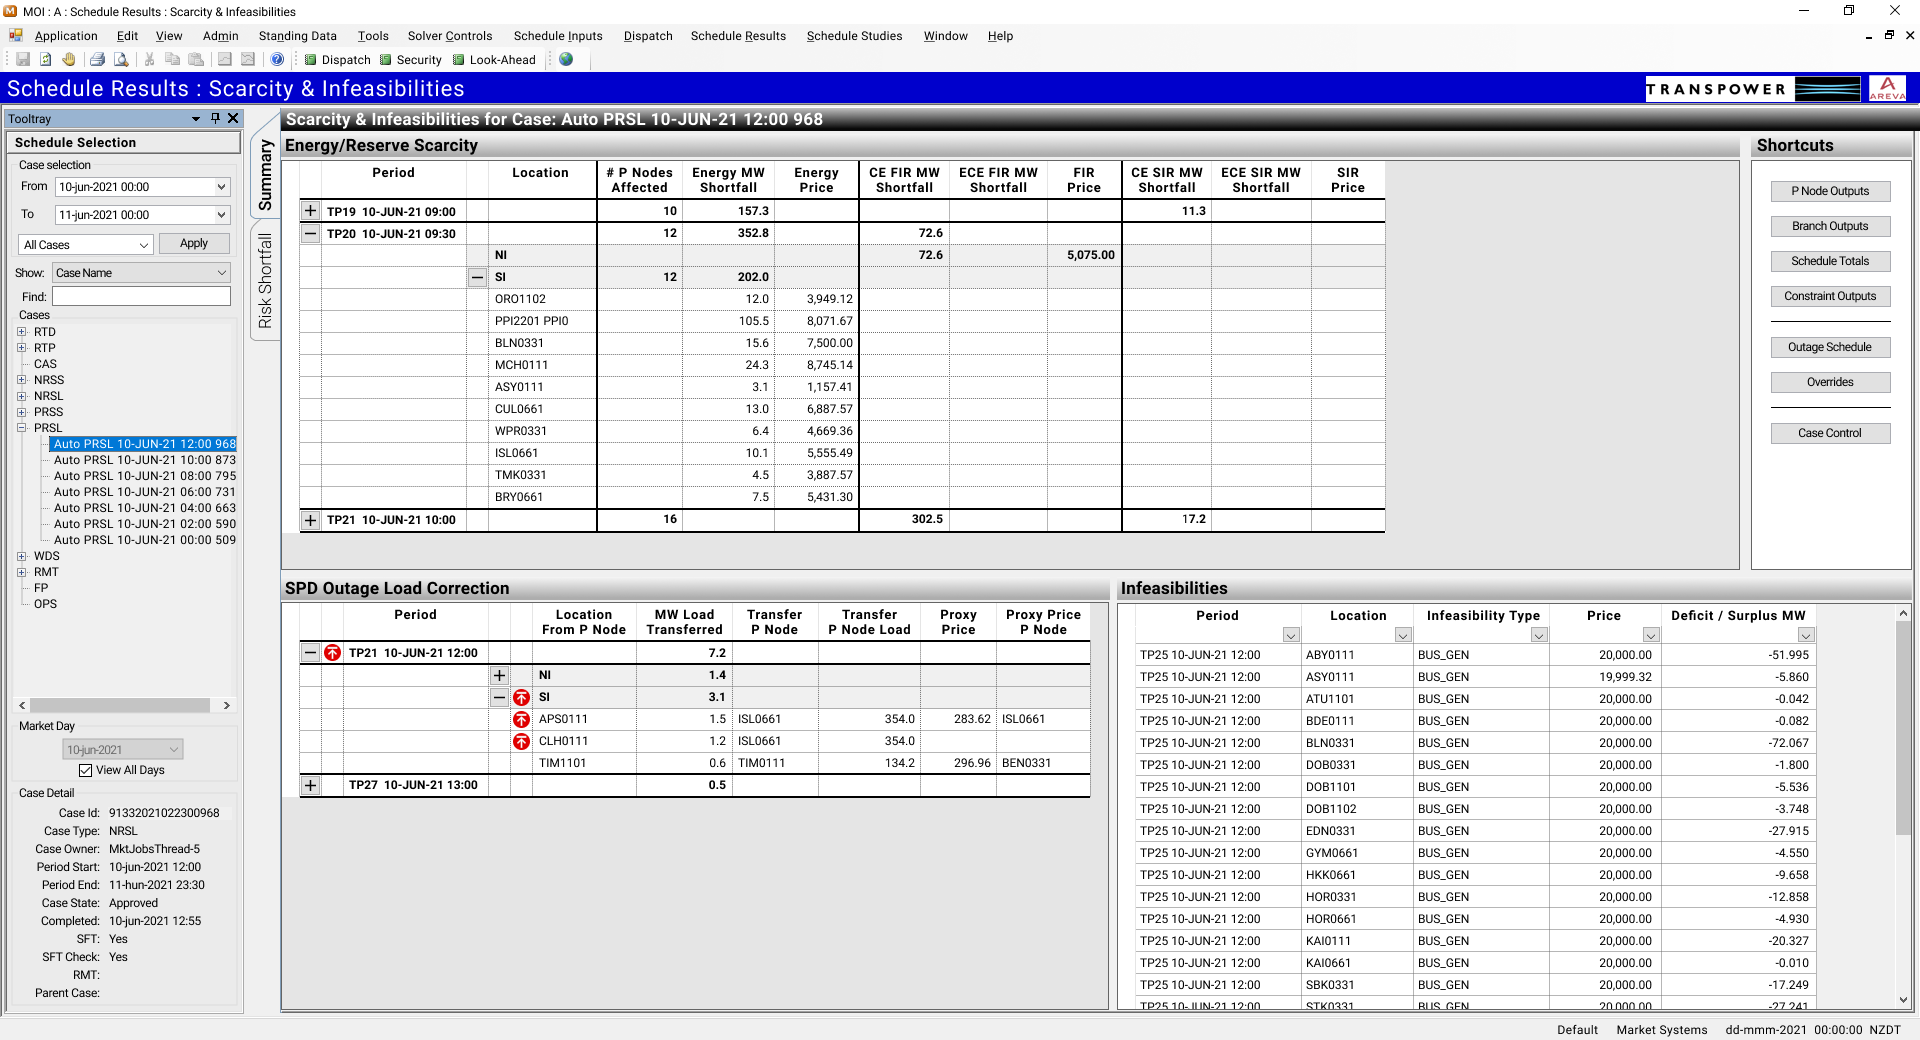
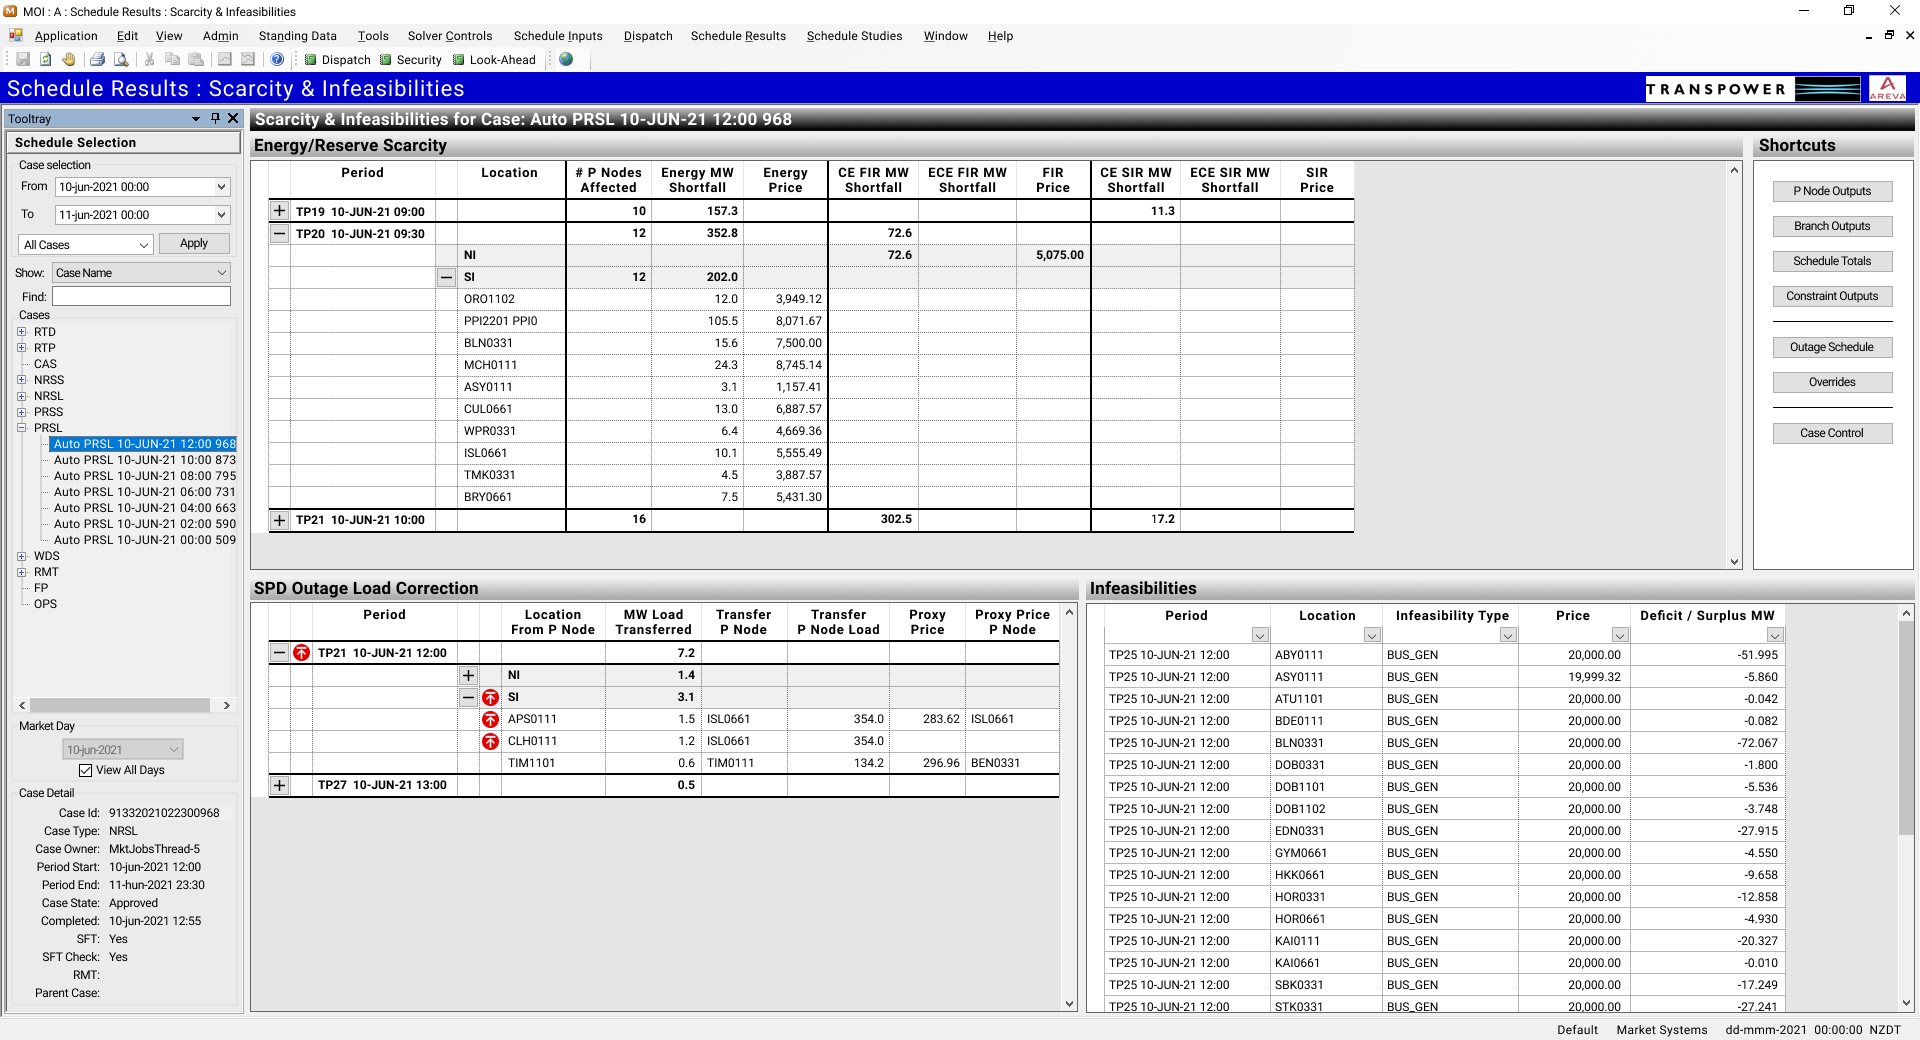
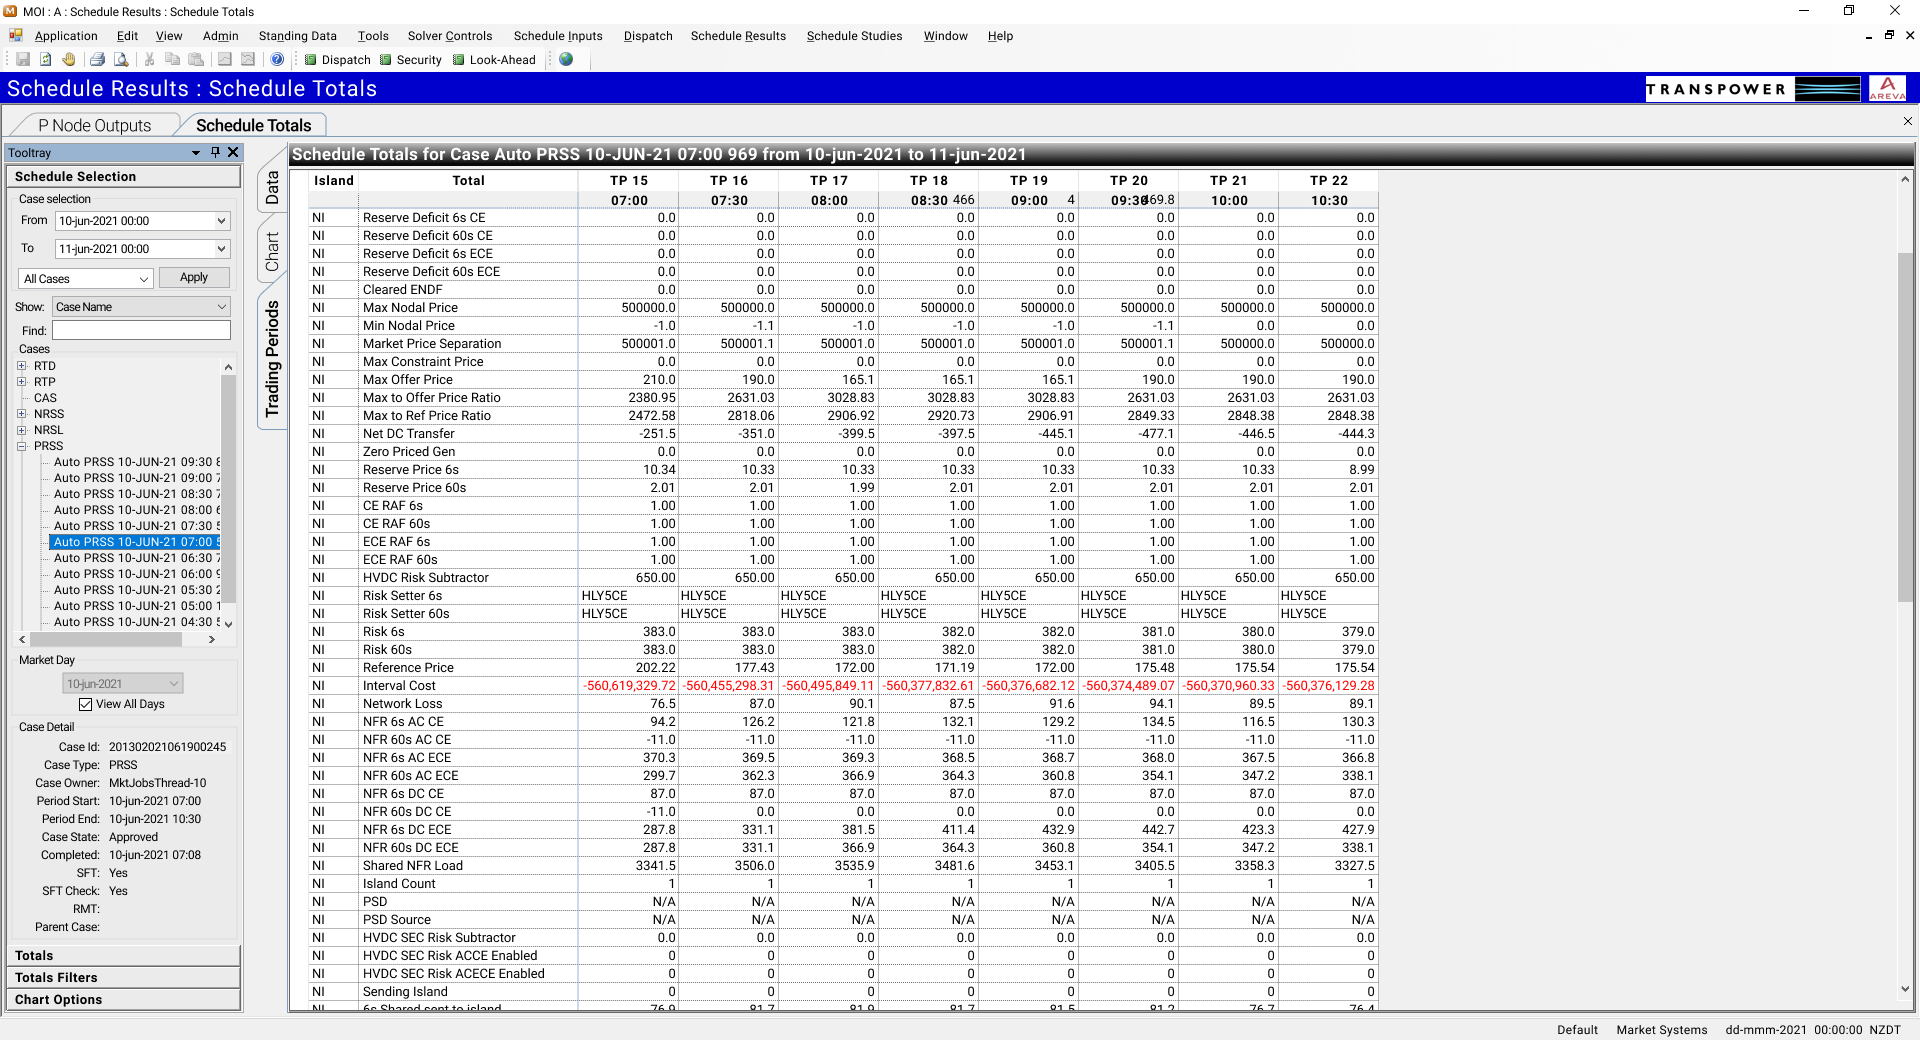
The screen design is not modern by today's standards but it is very efficient.
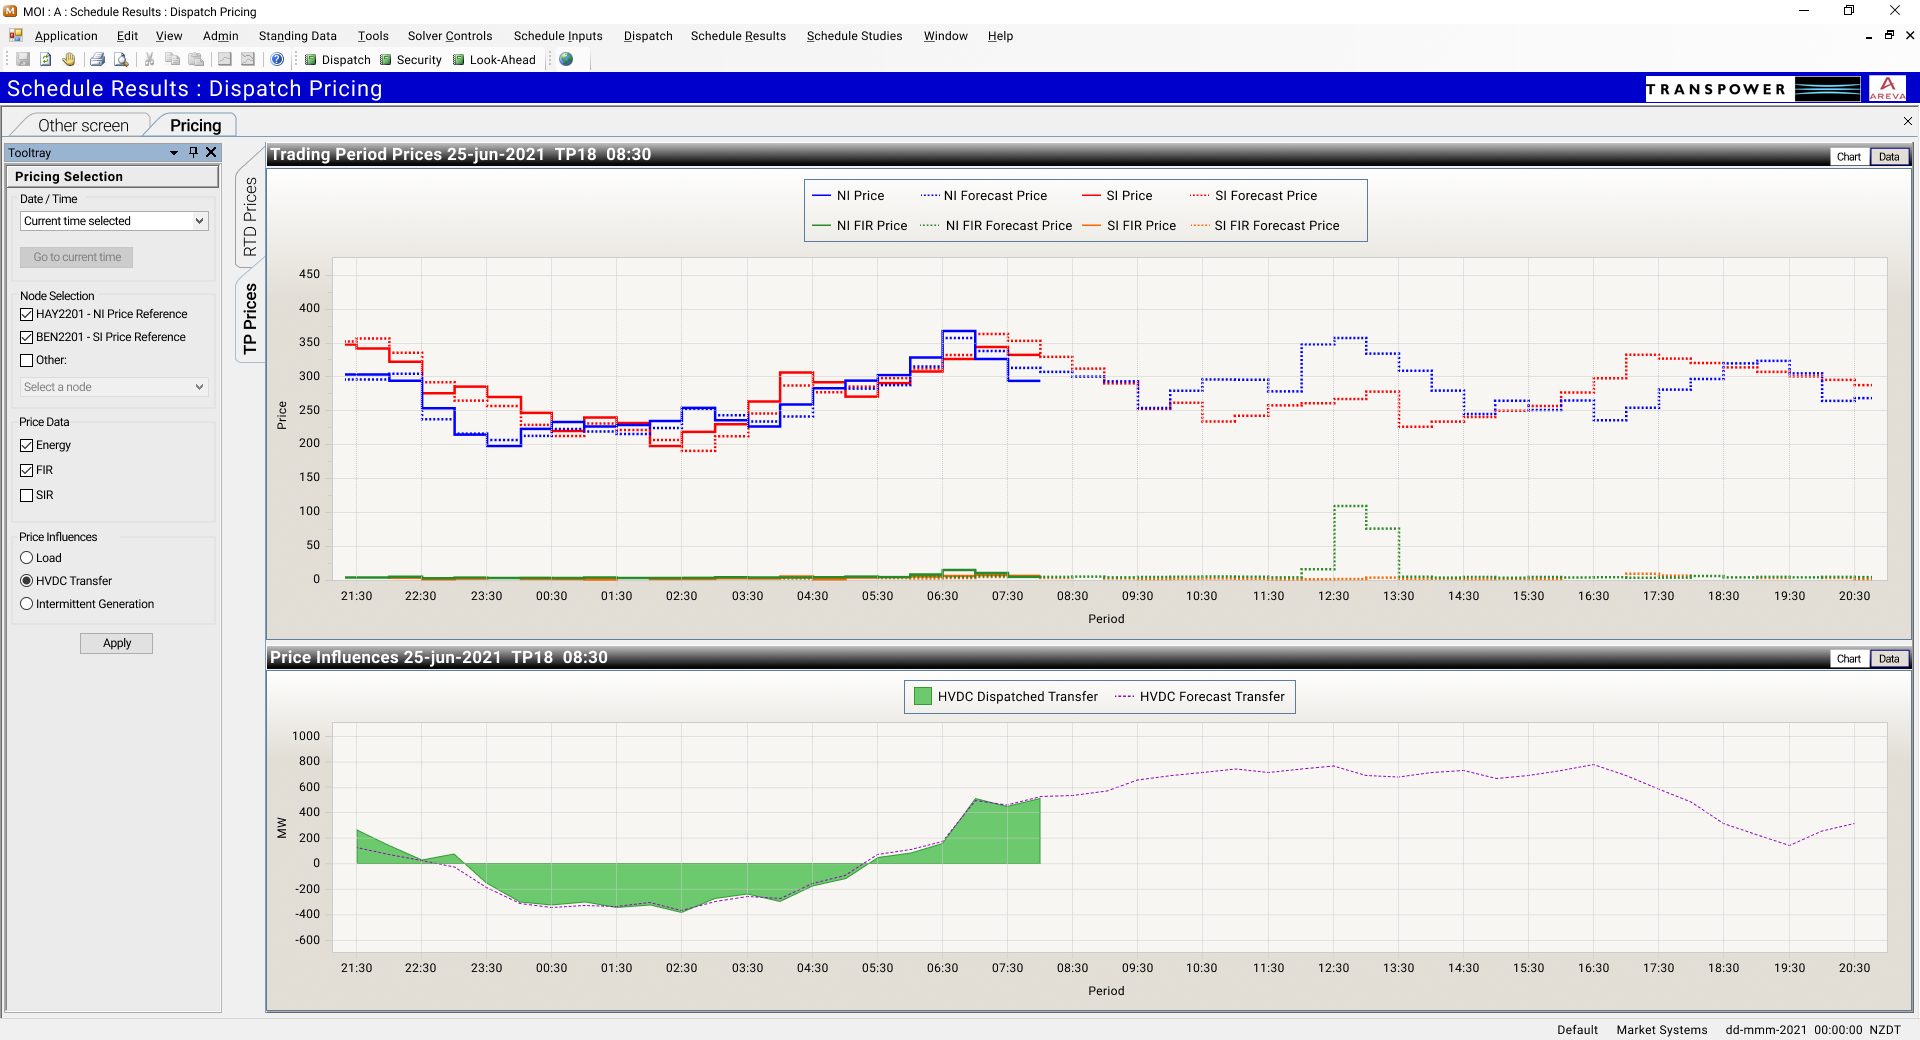
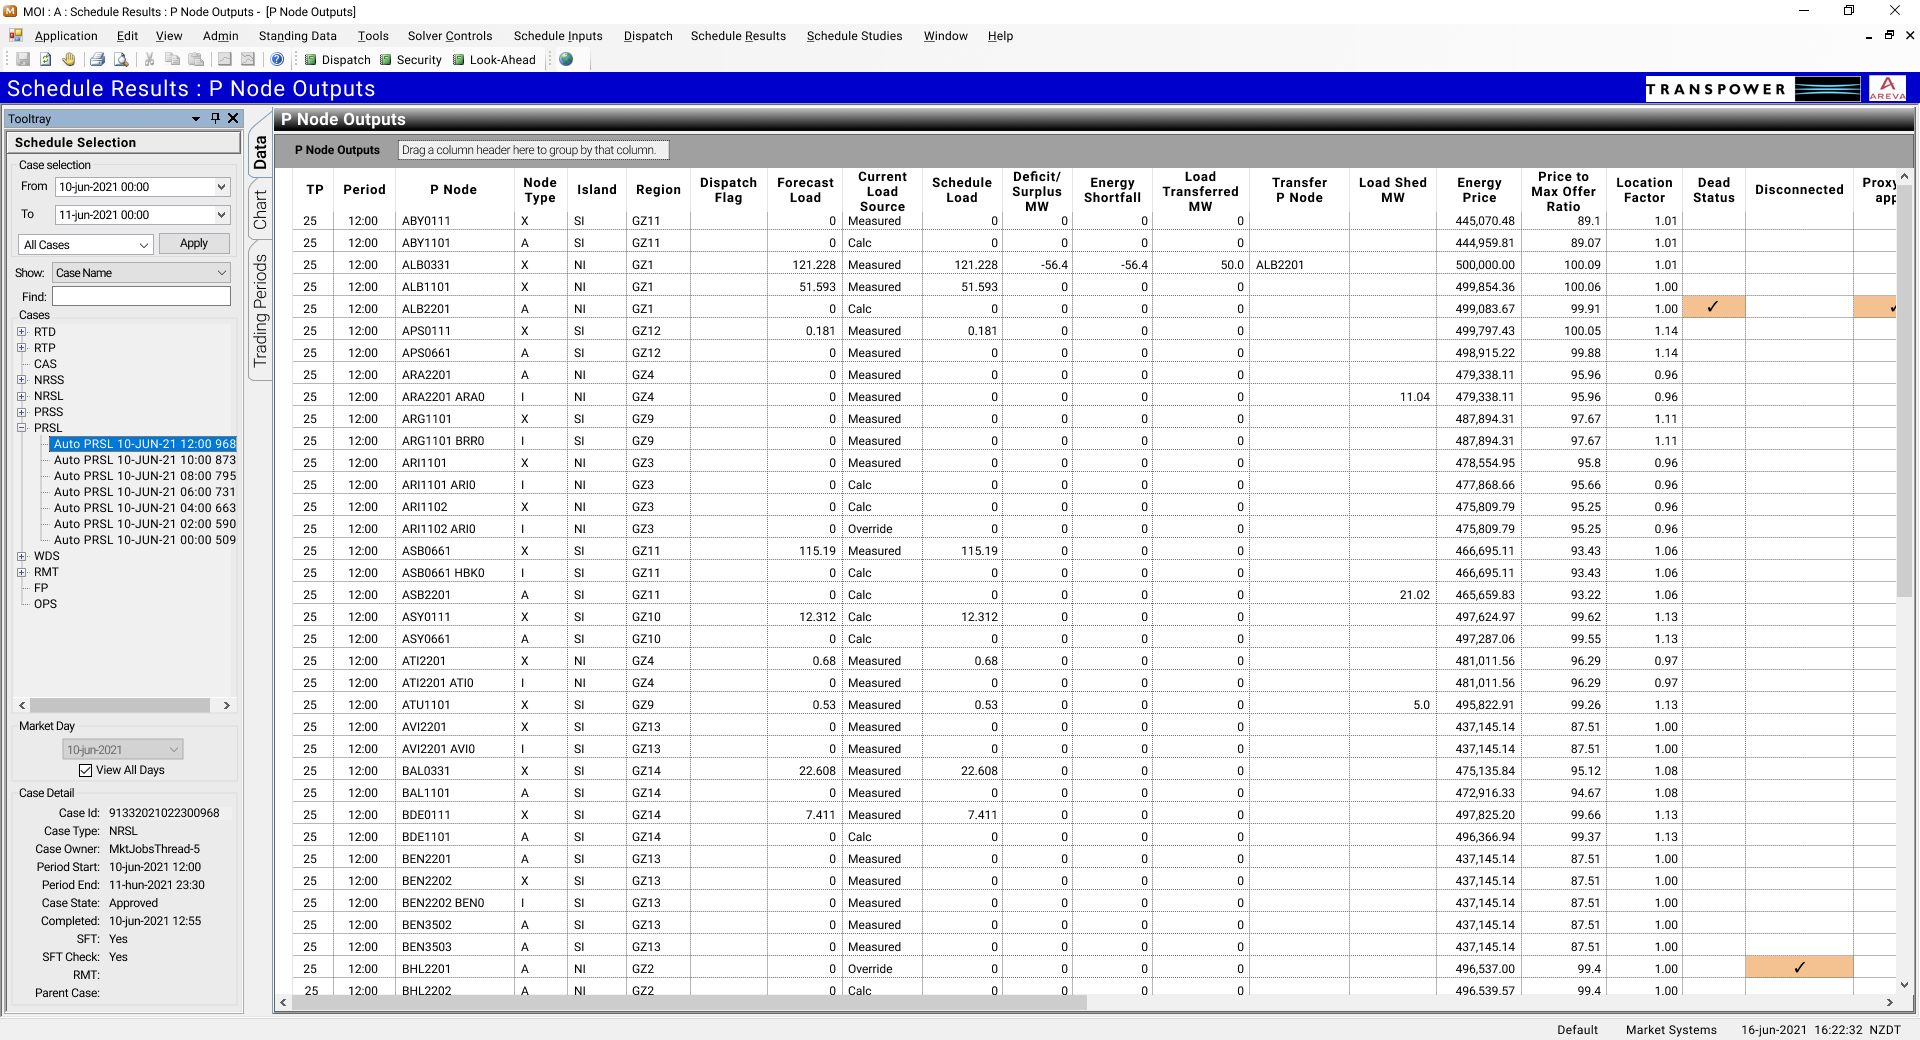
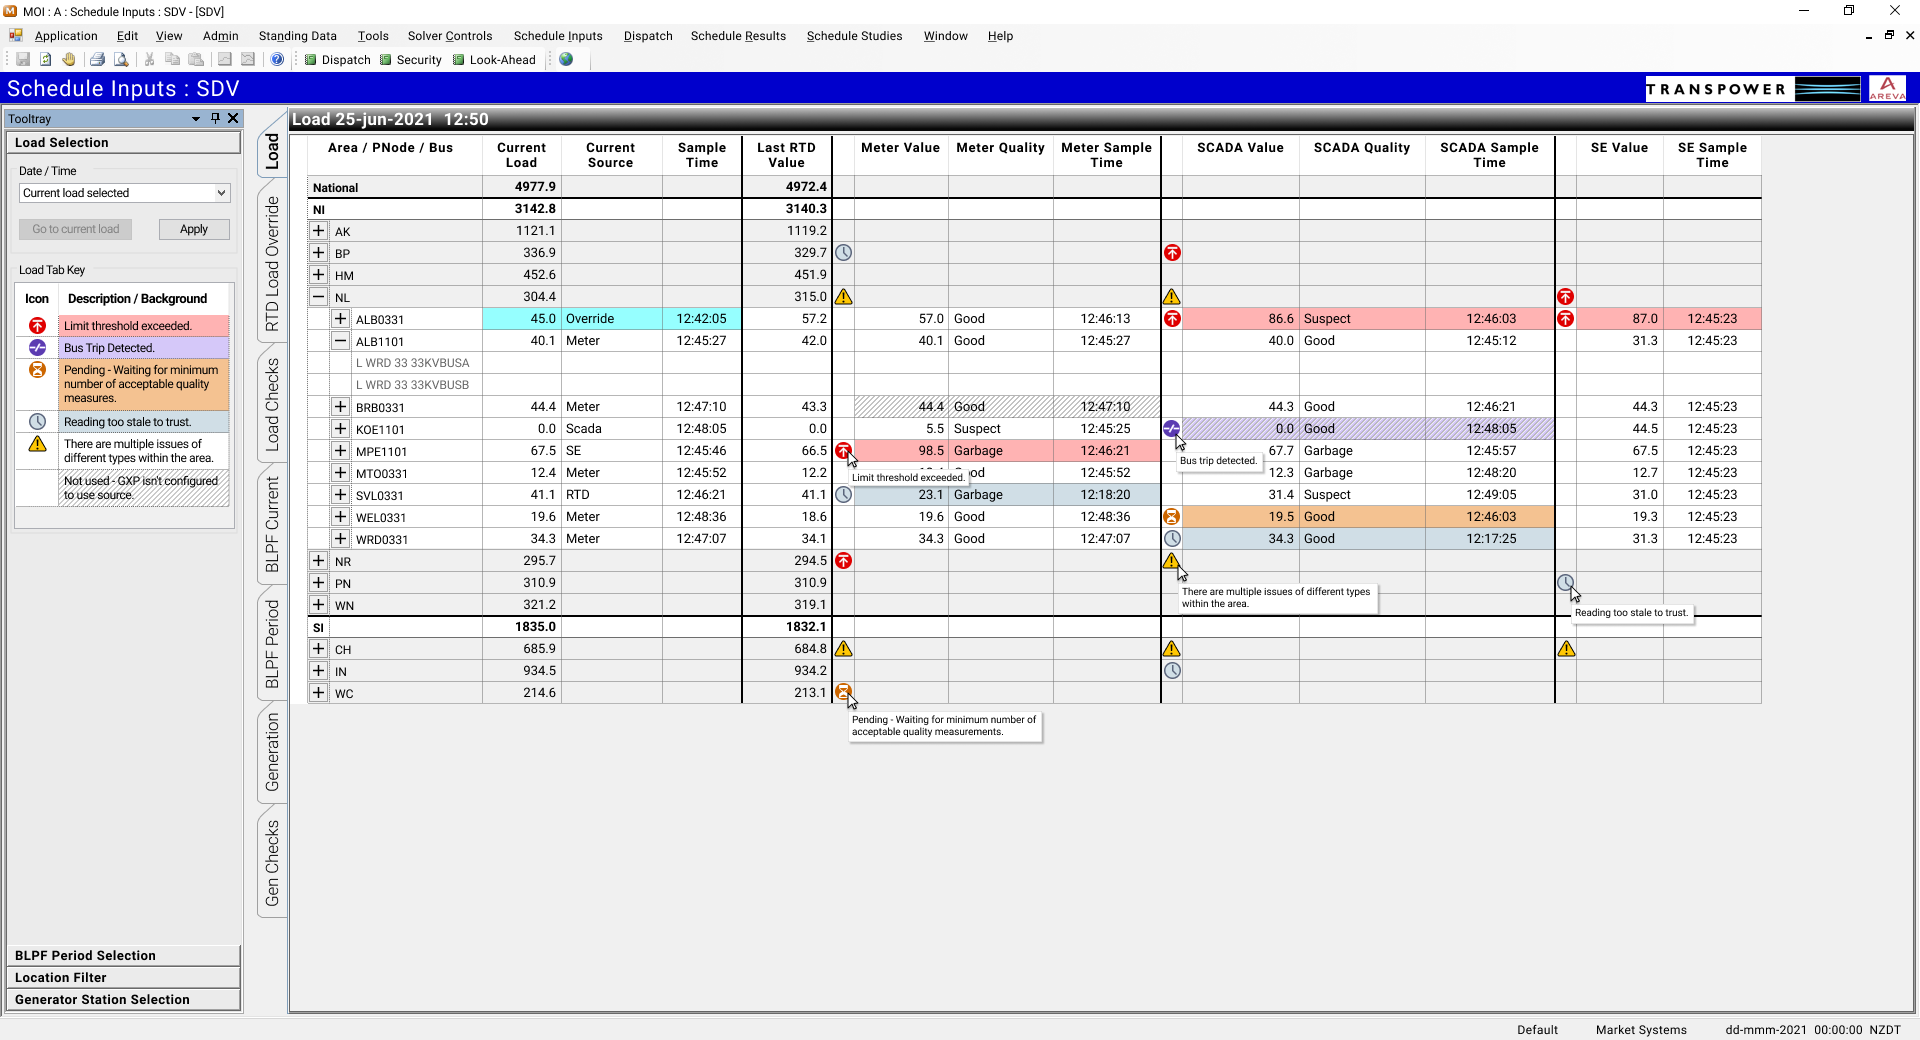
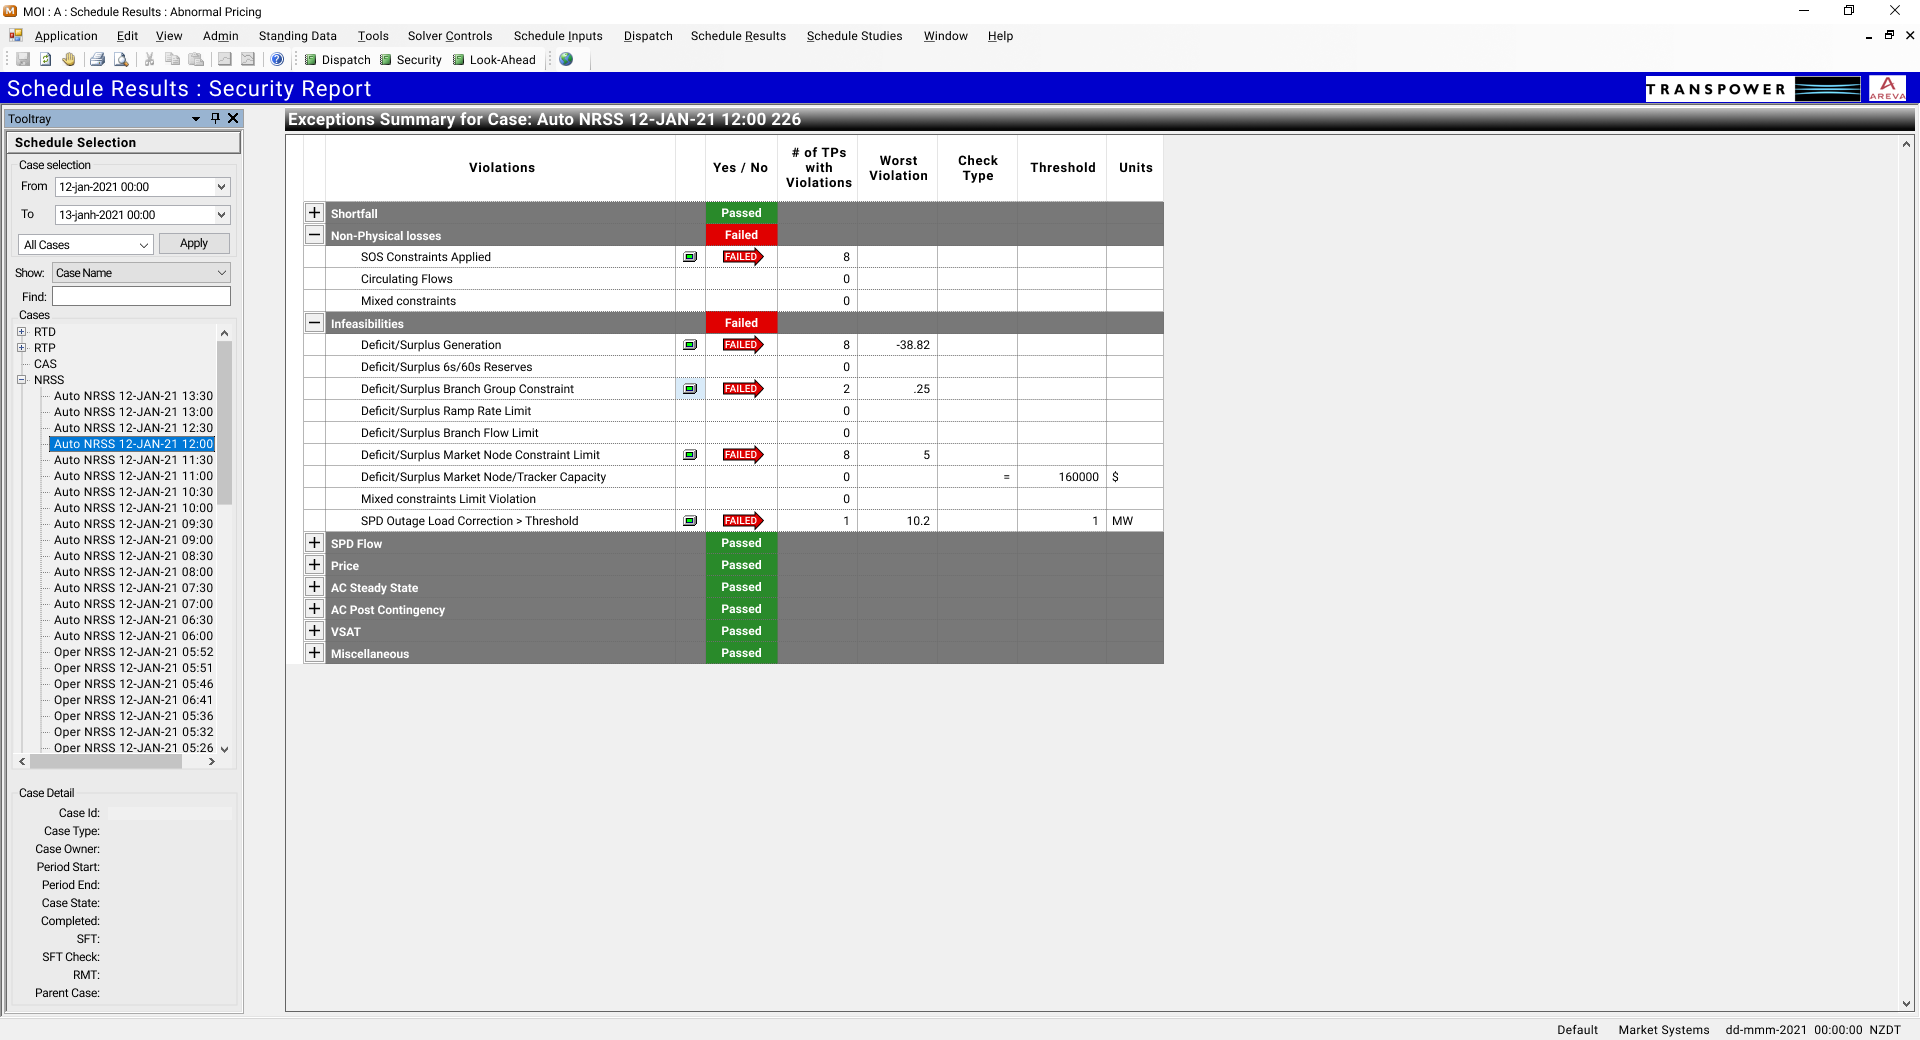
RTP screens
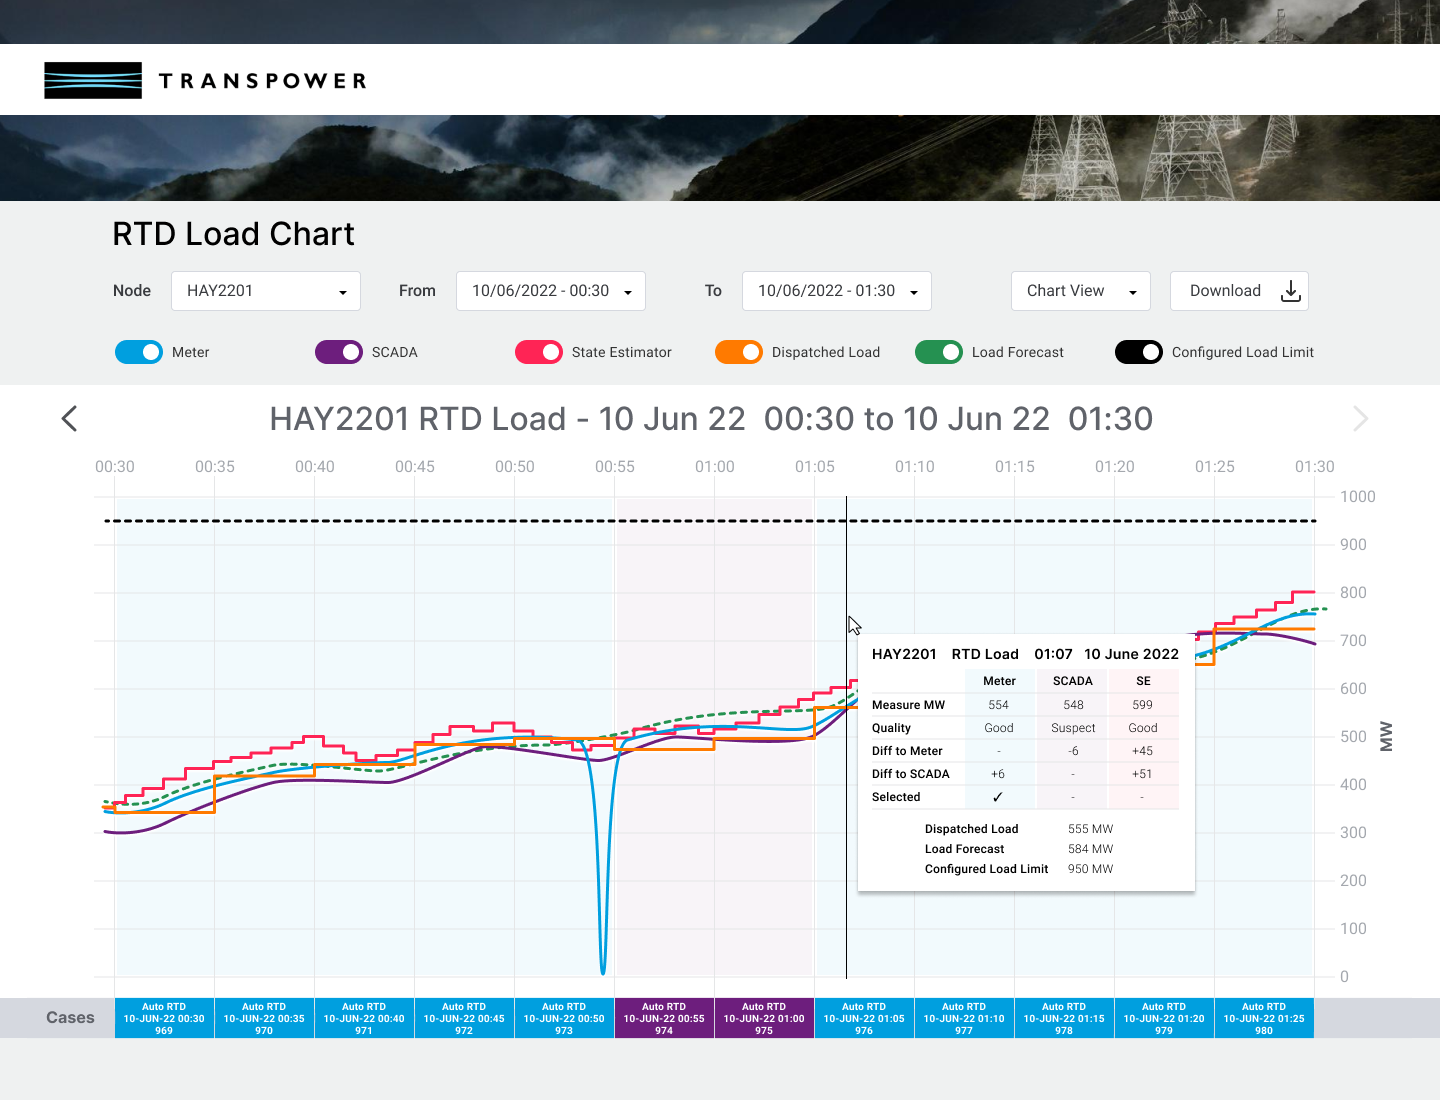
Figma was used to design and prototype the screens, as it was the best tool for sharing screen designs with the team and efficiently testing prototypes. The screens below look like screenshots of the system but they're actually fully built in Figma. Attention to detail was extremely important when testing with the operators.
Situational Intelligence
Another system at Transpower that's used widely by system operators and market participants is Situational Intelligence (SI). Because of the upgrade work that the RTP programme was implementing in the system, SI is now able to make use of the real time data that's now available. Below is some of the screens I designed to make use of this data.